A storage investment is two numbers, not one: how much power, and how many hours of it. The first is what auctions report and what gets quoted. The second decides what the asset can actually do once it is running, and in most expansion studies it is never really decided at all. It is assumed, before the model starts, by whoever wrote the candidate list.
That assumption carries more weight than it looks. Our new paper makes duration a decision instead of a parameter: we solved Brazil’s expansion to 2050 three times, changing only the set of storage the optimizer was allowed to choose from.
The three runs
Everything else about the runs is the same: demand, hydrology, wind and solar profiles, thermal fleet, transmission network, generation candidates and solver settings. Only the storage on offer differs:
- Pumped storage available. 36 pumped-storage candidates spanning nine durations from 4 to 144 hours, alongside the 4-hour batteries.
- Batteries only. The 4-hour batteries and nothing else. This is how storage usually enters an expansion study, and it is how Brazil is currently procuring it.
- No new storage. Generation and transmission alone, as the yardstick for what each fleet is worth.
Most of what follows is a difference between the first two runs. One built 31.2 GW of pumped storage and no batteries, the other 22.5 GW of batteries. The pumped-storage fleet has 39% more power, and fourteen times the usable energy.
Why duration is cheap in a reservoir
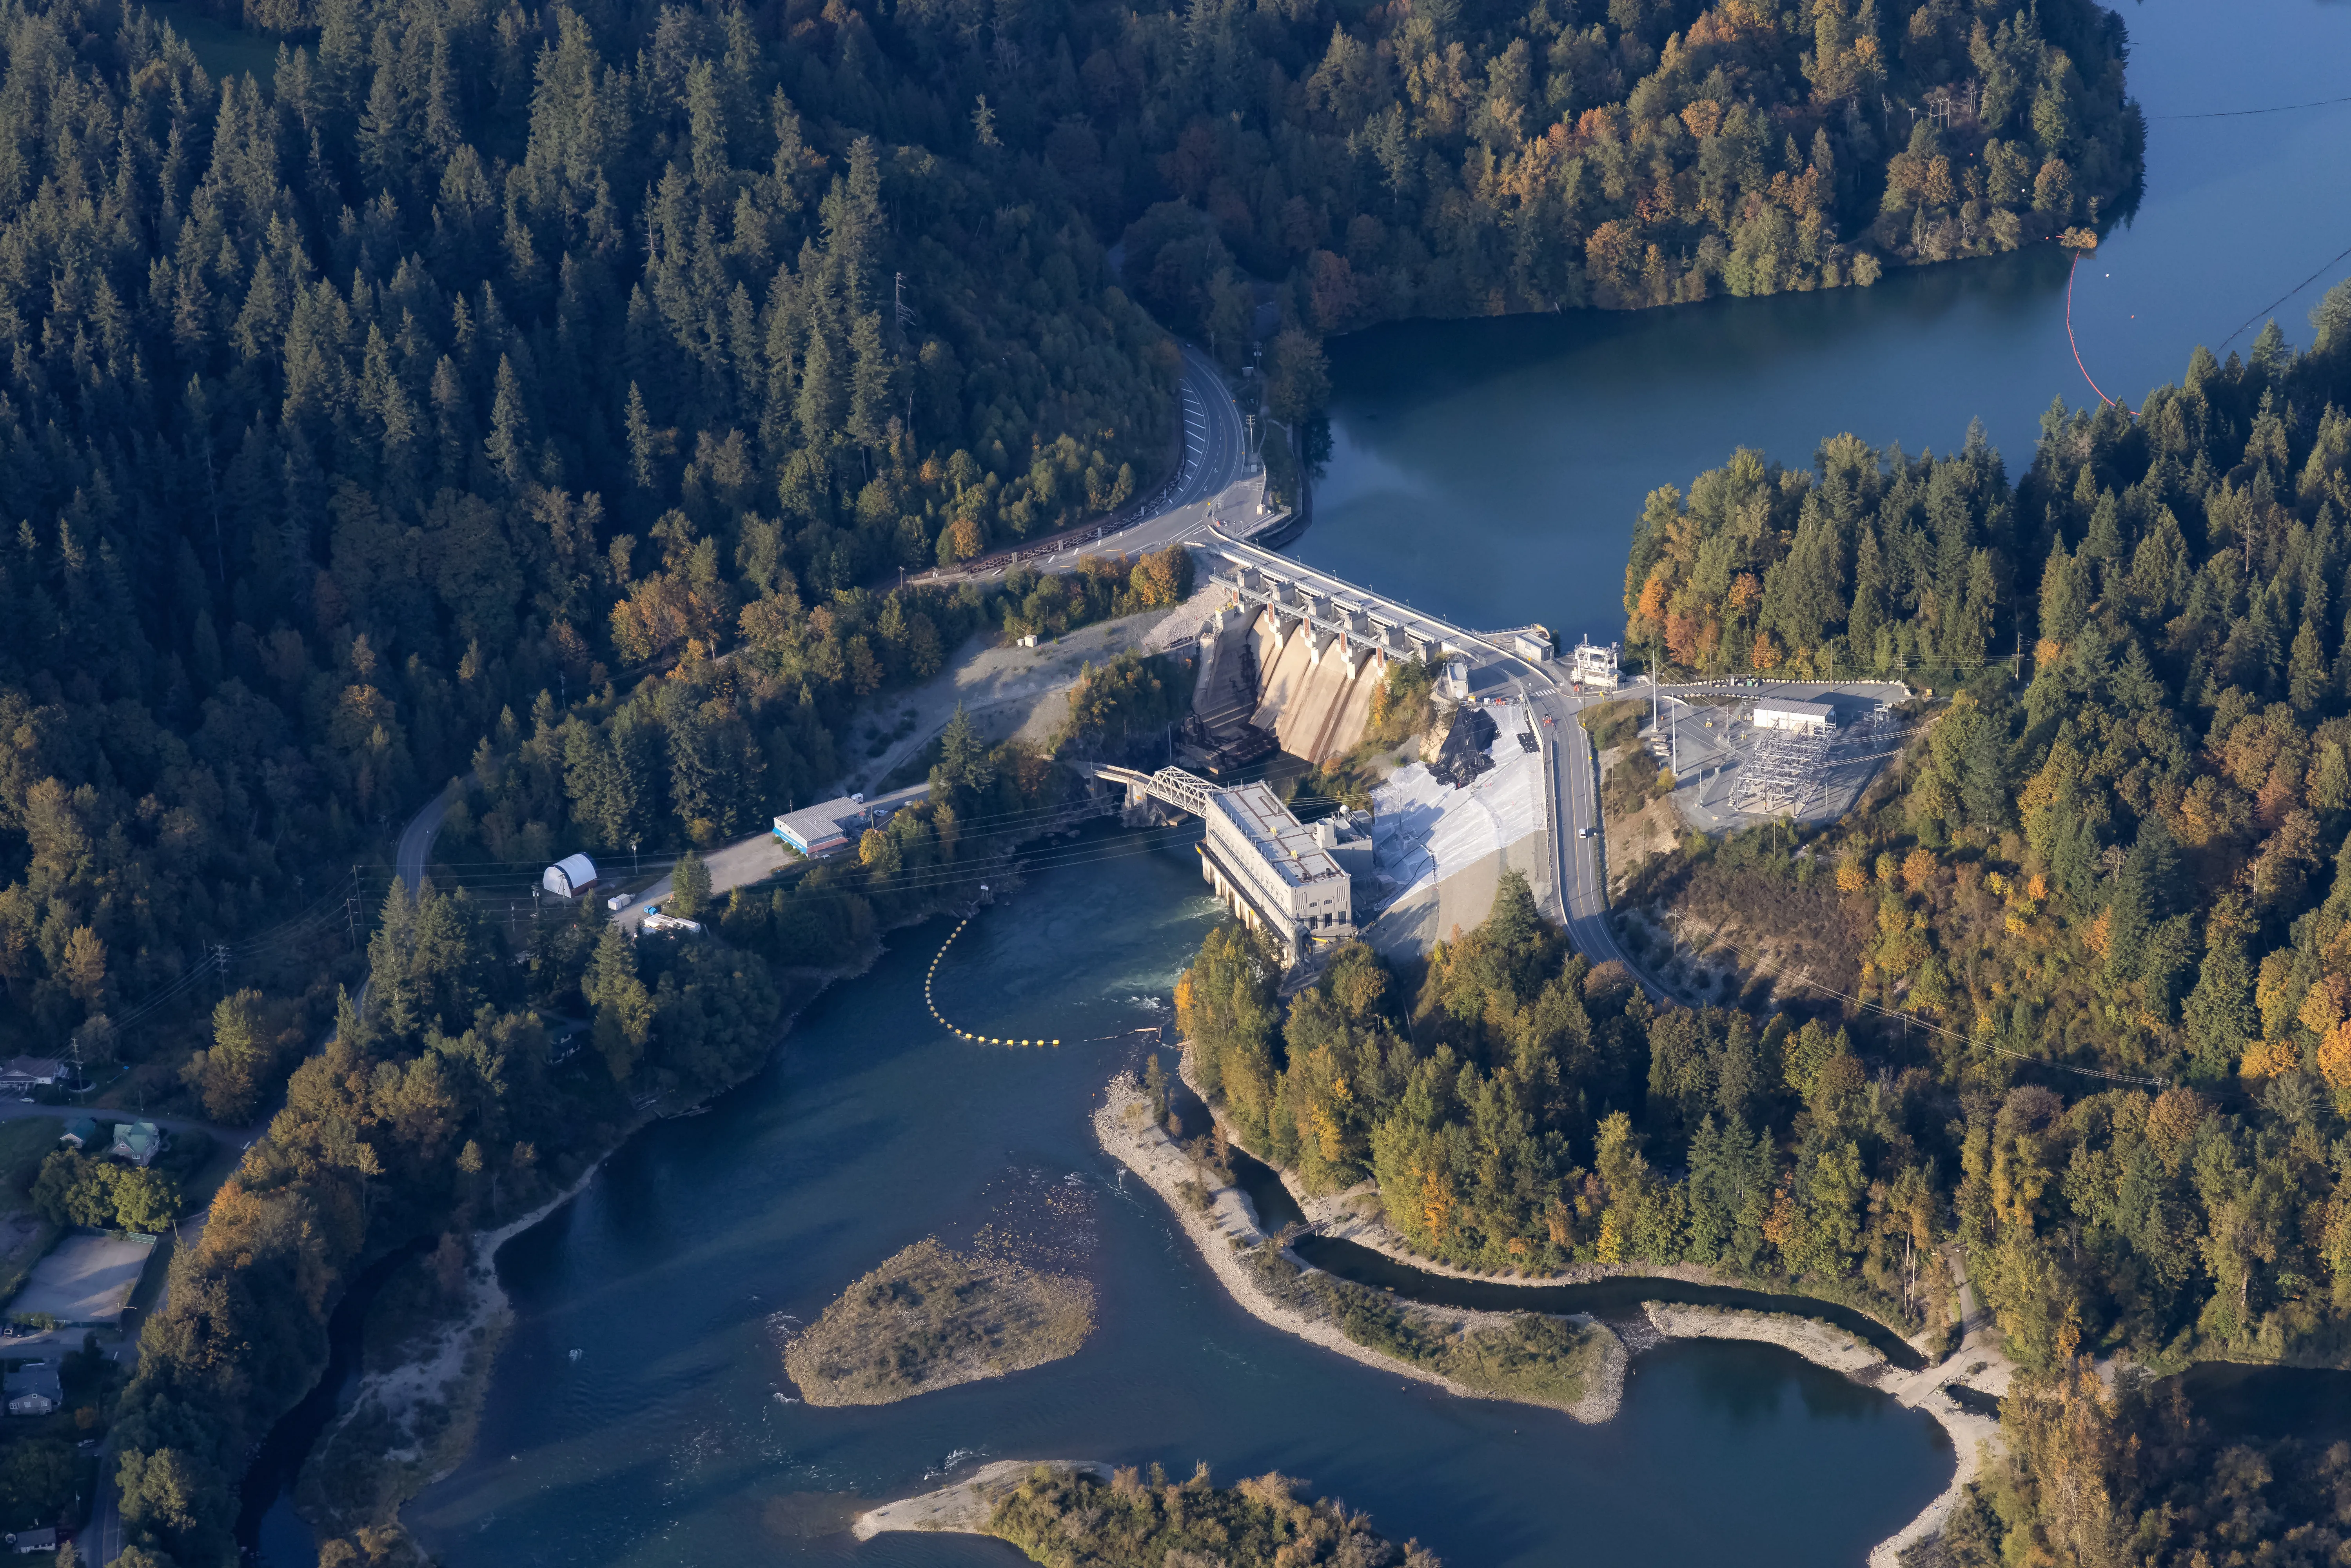
It helps to know first why long durations are on the table at all. In a battery, energy and power are the same hardware: doubling the hours doubles the cells. In pumped storage the two come apart. Power is the pump-turbine and the powerhouse. Energy is the volume of the upper reservoir, which is mostly earth, rock and geometry, and enlarging it is comparatively cheap.
Going from 4 hours to 72 buys eighteen times the energy for 41% more cost per kW. Divide each candidate by the hours it provides and the ranking turns over: roughly US$/kWh-year at 4 hours against at 72.
So a 4-hour battery is the cheapest way to buy a megawatt of storage (131.2 US$/kW-year against 184.6 for 12-hour pumped storage) and one of the most expensive ways to buy a megawatt-hour. A candidate list with only 4-hour units on it never puts that trade in front of the optimizer.
The model behind the runs
The formulation is a rolling-horizon, two-stage stochastic linear program, solved for five planning years from 2030 to 2050. The first stage decides how much of each candidate to build and where. The second operates the system hour by hour across scenarios. The objective is annualized investment cost plus expected operating cost, so investment and dispatch are decided together.
Two details of the operational subproblem matter for the duration question in particular.
Full chronology, at hourly resolution. All hours of each year stay in sequence, with state of charge linked hour to hour across the whole year. Aggregating into time slices or representative days would erase exactly the multi-day and seasonal behaviour that separates a 72-hour reservoir from a 4-hour battery, which is to say it would decide the answer in advance.
One set of storage equations for every candidate. Batteries and all nine pumped-storage classes share the same state-of-charge formulation. They differ only in energy-to-power ratio, round-trip efficiency, usable depth of discharge, cost and deployment limits.
Uncertainty enters as ten joint hydro–wind–solar scenarios, clustered from 200 synthetic inflow sequences, with hourly wind and solar profiles from reanalysis data that keep their chronological alignment with the inflows, so a dry year still looks like a dry year across every resource at once.
The Brazilian case covers four subsystems plus the Imperatriz hub, with hydro aggregated into four equivalent reservoirs, 296 thermal plants, 391 renewable agents and 221 candidate projects, against a 2050 demand of 195.9 GW average and 243.0 GW peak. Each planning year is a single linear program of up to constraints, solved without decomposition by the FICO Xpress barrier method. Offering nine duration classes rather than one tripled the solve time for the full horizon, from 7.5 to 23.8 hours.
What each run built
In power the fleets are 31.2 GW against 22.5 GW. In energy they are nowhere near each other: the pumped-storage fleet holds 780 GWh and can cycle all of it, while the battery fleet holds 90 GWh on paper and can cycle 54 GWh, because it keeps 20% of its charge in reserve at each end.
The pumped-storage fleet is also not all one duration.
Four of the nine offered durations got built. The 4-, 6- and 8-hour classes got nothing: the 12-hour class costs only 11% more per kW and holds far more energy. The 100- and 144-hour classes got nothing either. The 12-hour class takes 22.2 GW of the 31.2 GW total, most of it in the Southeast where it firms the solar build-out, and the long tail is small but does real work: 1.9 GW at 24 hours, 2.0 GW at 48, and 5.2 GW at 72, almost all of the last in the Northeast wind hub.
The two runs also disagree about when to build. Pumped storage shows up early, 8.3 GW by 2035, and grows at every stage after that. The battery fleet barely moves for three stages, 2.4 GW in 2035 and 6.7 GW by 2045, then jumps to 22.5 GW at the end. Storage that is cheap per kW but short on energy is worth deferring until the year its capacity is actually needed. Storage with a large reservoir behind it starts displacing fuel the day it is commissioned, which pulls the investment forward.
The rest of the plan moves with it
A duration assumption does not stay inside the storage decision. These are the four technologies worth watching alongside it. Each panel has its own scale. The solid line is the pumped-storage run, the dashed line the battery-only one, and the dotted line the run with no new storage.
Two of them move, and they move at different times.
Gas capacity separates immediately. By 2035 the battery-only run has already built 3.7 GW of open-cycle peakers against 0.4 GW, and the gap keeps widening to 37.0 GW against 26.2 GW of new gas-fired capacity by 2050, 10.8 GW more to serve the same demand, because its storage runs out of energy before the evening is over. The extra splits evenly between peakers and LNG combined cycle. The 10 GW block of must-run pre-salt gas is built in both runs, and no amount of storage displaces it. Thermal re-contracting moves less, 7.5 against 6.7 GW.
Solar separates late. The two runs are identical through 2040 and only come apart in the last two stages, ending at 58.3 GW with pumped storage against 28.2 GW without, more than double. A fleet that can move energy across the whole day makes midday solar worth more, so what is worth building elsewhere in the system depends on what storage was on the list in the first place. Part of that solar replaces offshore wind, which falls from 18.3 to 10.8 GW.
The order is worth noting. Take long-duration storage off the menu and the plan reaches for gas straight away, then gives up on solar later.
Onshore wind, the fourth panel, does not notice: 126.2 GW in all three runs, because the per-state resource limits bind. Transmission reinforcement is 2.8 GW smaller with pumped storage. The dotted line shows what both fleets are replacing, peakers and offshore wind in favour of solar, one of them at several times the scale.
Two different clocks
The duration mix comes out mixed because the balancing work is mixed. Variable renewables create imbalances on several timescales at once, and any single energy-to-power ratio is a commitment to one of them.
This is one week of 2050 in a single scenario, the week with the largest swing in the 72-hour fleet’s state of charge, showing how much energy each fleet is holding hour by hour.
The 12-hour fleet fills and empties once a day, following the solar profile. The battery fleet, in the run where it is the only option, does the same thing in a shallower band, visibly pinned between 20% and 80% of its nameplate. The 72-hour fleet does something else entirely: it discharges at full power through the first day, is empty by the second morning, then spends the next five days refilling to its full 375 GWh. One cycle across the week rather than seven. No quantity of 4-hour batteries reproduces that shape, and it is what covers multi-day wind lulls and the stretches when must-run LNG plants cannot back down.
The daily half of the job shows up on the average day. Take demand, subtract renewable output and whatever storage is doing, and what is left for the rest of the system to cover swings across 32.3 GW in the pumped-storage run against 35.8 GW with batteries only, even though the pumped-storage run starts from a much deeper midday valley, since it carries 30 GW more solar. The battery curve also climbs higher into the evening, because by that hour the fleet has already emptied.
What it buys
In 2030, before any fleet exists, all three runs spill 12.5% of the renewable output available to them. After that they separate, and the gap between the storage runs is widest early, 7.2% against 2.8% in 2035, before narrowing to 3.7% against 1.9% by 2050, and it narrows only because the battery fleet is finally built out in the last stage. With no storage the share is 8.2% in 2035 and, unlike the other two runs, climbs again after 2045 to 5.2%, as the late solar and offshore wind additions arrive with nothing to shift their output.
Within each year the surplus concentrates in the dry season, June to October, when Northeast wind is at its strongest at the same time as LNG-linked thermal plants are contractually obliged to run. That surplus lasts days at a time, which is the clock the 24- to 72-hour units are there for.
The two plans cost almost the same to build. Annualized capital expenditure in 2050 is 52.7 billion US$ a year with pumped storage against 52.1 without: the pumped-storage annuities are almost entirely offset by the batteries, gas, offshore wind and transmission the plan does not build. Nearly all of the difference is in operation: operating cost falls from 21.0 to 16.1 billion, a 23.4% reduction, as 35.4 TWh of thermal generation is displaced. Avoided curtailment and unserved energy account for about a quarter of that, and the rest is fuel.
Totals are 68.8 against 73.1 billion US$ a year, 4.3 billion cheaper, or 5.9%. The saving does not wait for 2050: it is already 0.8 billion a year in 2035, and it widens at every stage.
The run with no new storage puts both fleets in perspective. It costs 74.0 billion a year in 2050. Against that, batteries alone save 0.9 billion, or 1.2%, and pumped storage 5.2 billion, or 7.0%, so 4-hour batteries capture less than a fifth of the value the full duration list delivers. Energy prices say the same: the long-run marginal cost in 2050 is 107.5 US$/MWh with no storage, 106.6 with batteries, and 91.5 with pumped storage.
Where this leaves Brazilian procurement
The question is live here rather than hypothetical. Brazil’s ten-year expansion plan, PDE 2034, includes storage for the first time but selects no pumped-storage capacity, and the first capacity-reserve auction for storage was written for batteries only. A duration is being procured, in other words, before it has been settled in planning, and given the full list to choose from, the model does not pick the one on offer.
The implication is narrow and concrete: procurement should specify deliverable energy, or duration, alongside megawatts. A specification in MW alone would put the two fleets in this study within 40% of each other, when one of them delivers fourteen times less energy than the other. And on these numbers an auction open to 4-hour batteries alone buys less than a fifth of the storage value on the table.
None of this makes pumped storage the right answer everywhere. Brazil has the topography, an existing hydro fleet to work alongside, and a wind resource whose lulls run for days. A system with different geography would land somewhere else. What carries over is the method. If duration goes into the model as an assumption, it comes out as one, and the study will understate how much energy storage the system wants while overstating how much thermal capacity it still needs.