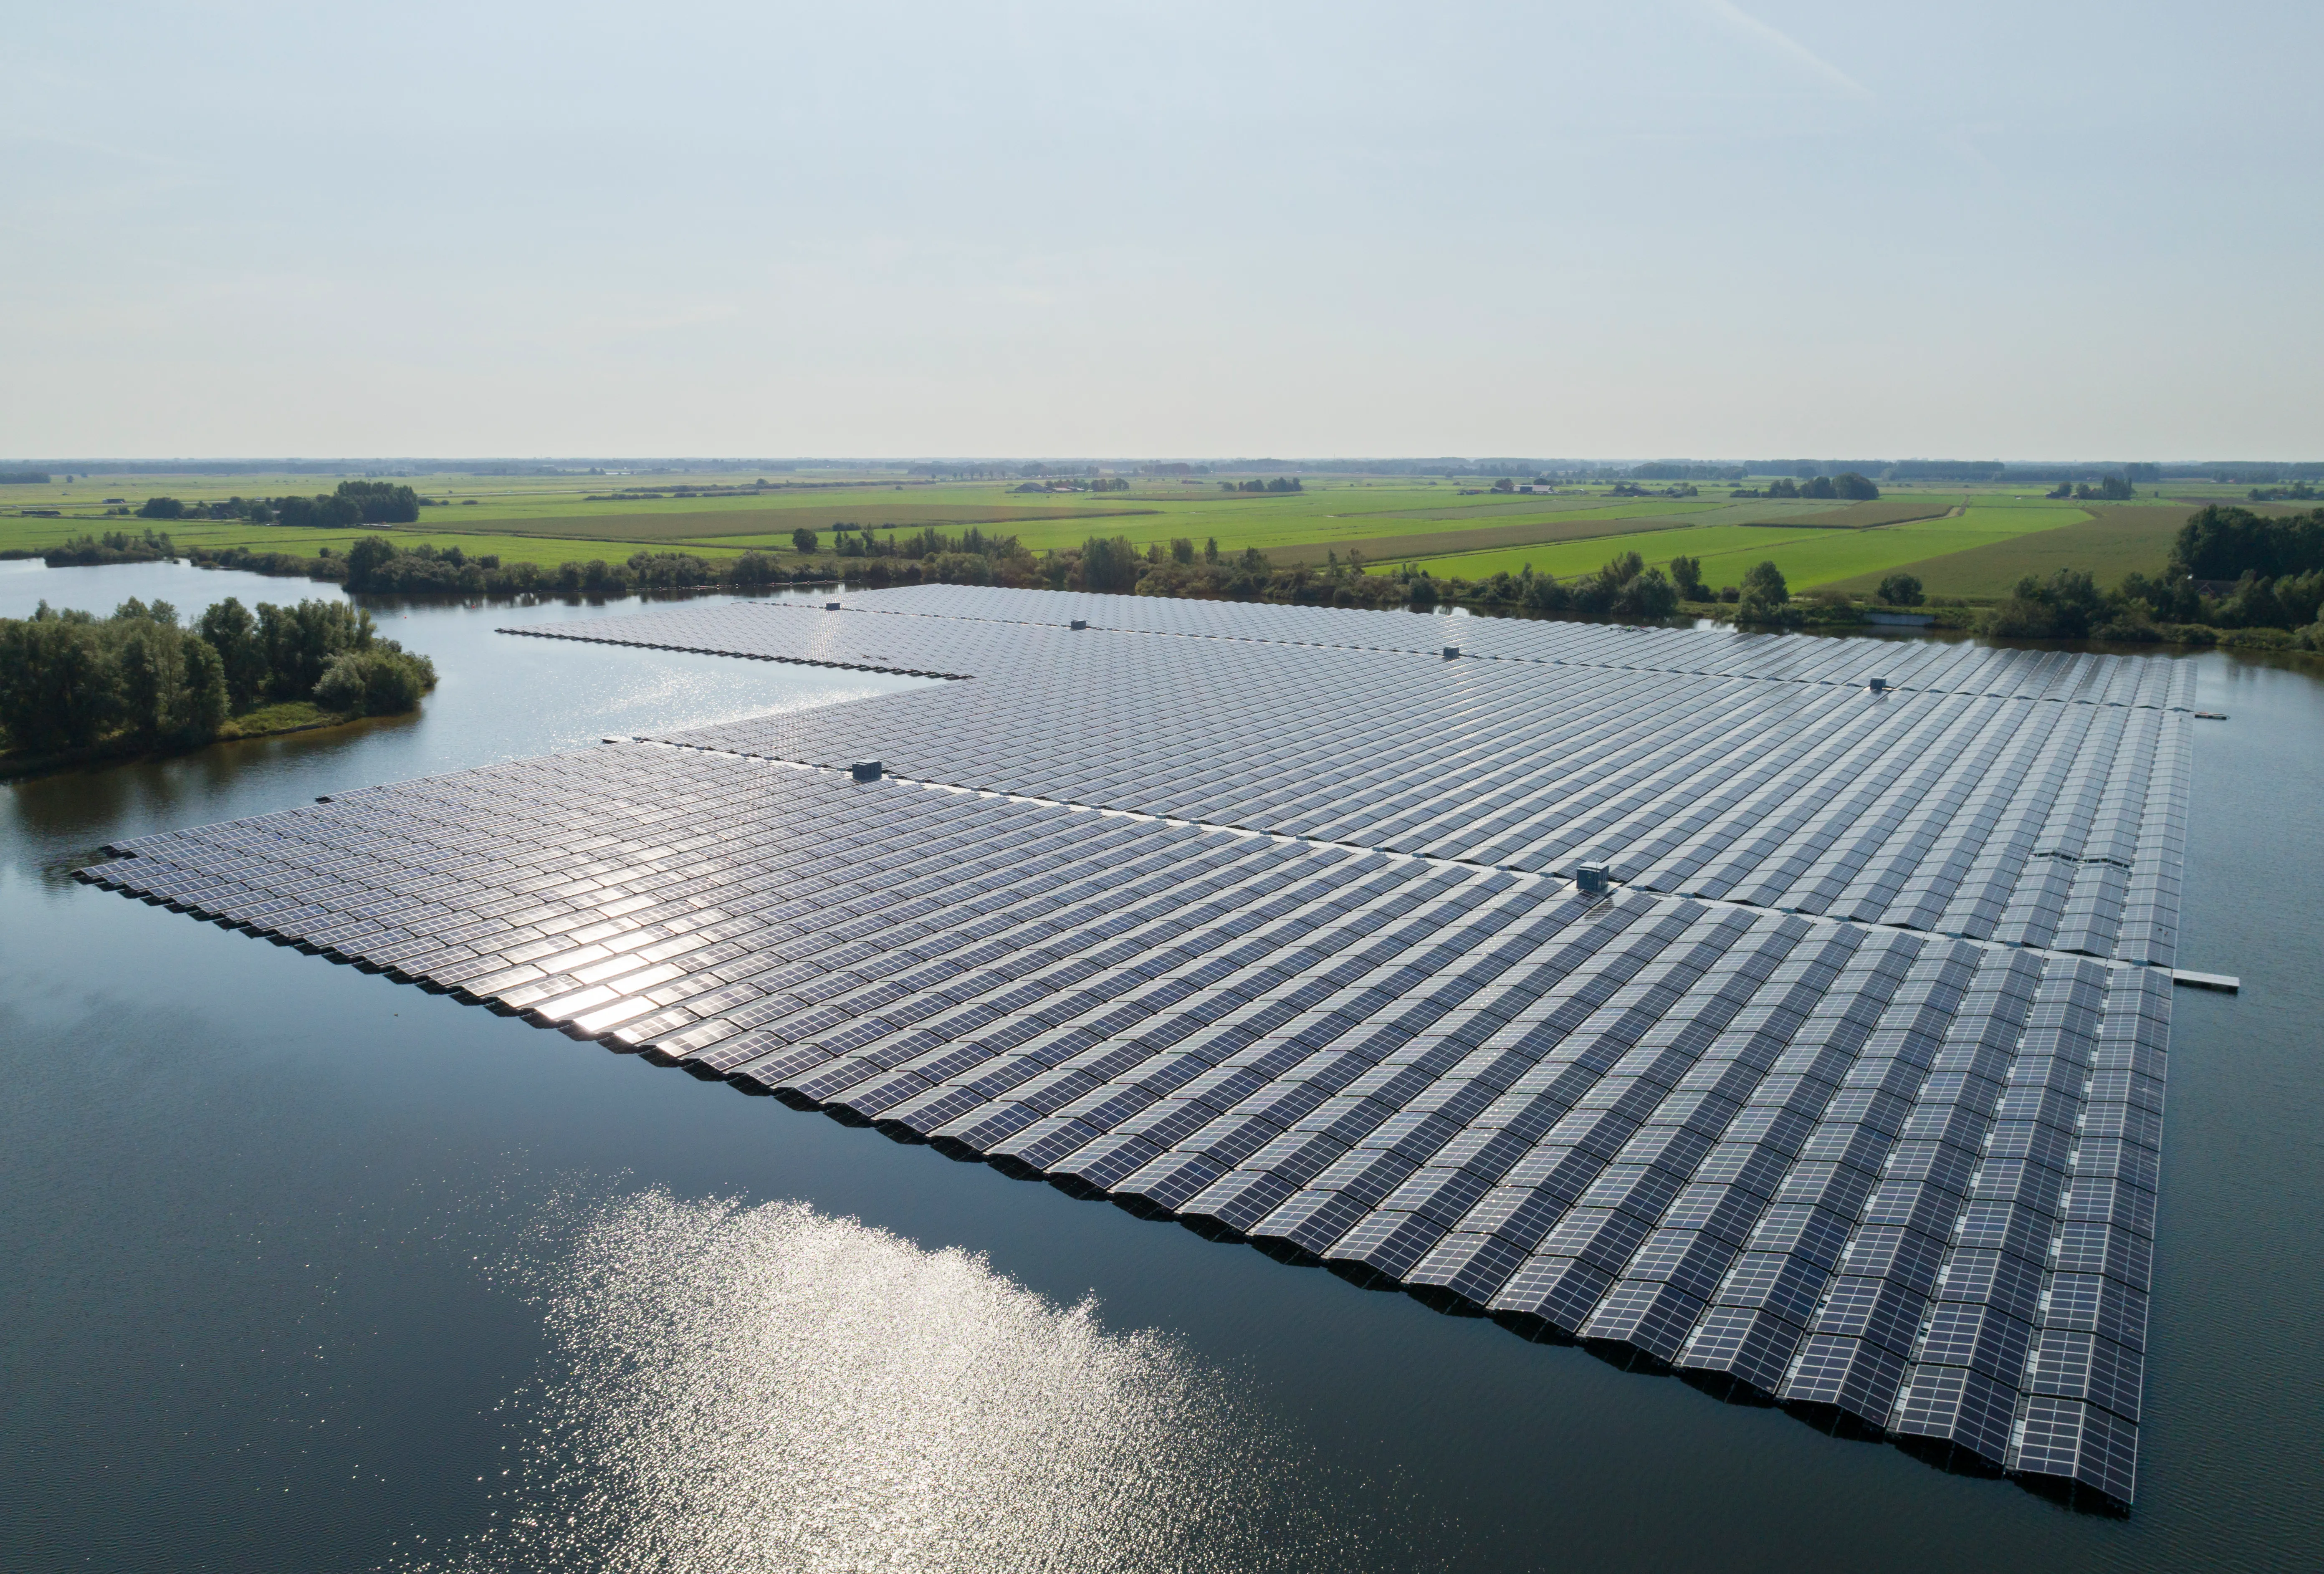
Floating photovoltaic (FPV) plants on hydropower reservoirs can add a lot of capacity to a power system. At 100 MWAC per km² (around 130 to 140 MWDC), covering all of Brazil’s reservoirs would install 2,265 GW at minimum operating level and 3,800 GW at maximum, or 3,100 GW at mean area. That is eight to ten times the country’s entire electricity consumption.
The theoretical potential is enormous, so it is not the useful number. What limits FPV in practice is the substation the solar plant would share with the hydropower plant, the operating limits of that plant, and how much room the rest of the system has for more non-dispatchable energy. This post estimates that technical limit.
The model
We estimate how much FPV could be installed in Brazil considering:
- The solar radiation available at each reservoir site, from ERA5 reanalysis of the grid cell containing the hydropower plant, converted into hourly production factors
- The substation capacity of the existing hydropower plant
- The operating limits of the hydropower plant, including minimum production, usually tied to environmental minimum flows
- A cap on solar curtailment and on the reservoir area FPV may occupy
- Technical data for each plant from ONS: reservoir areas, installed capacity and minimum generation
The formulation is the following.
The objective (1) maximizes the net revenue of FPV: the revenue of the solar production at reservoir in hour , sold at the price ($/MWh) and divided by the number of years in the horizon, minus the annuity of the installation cost ($/MW) times the installed FPV capacity (MW), which is the decision variable.
Constraints (2) say the power injected, solar plus hydro, cannot exceed the grid connection capacity contracted by the hydropower plant.
Constraints (3) hold the hydropower plant to its historical daily production, taken from ONS records. Within the day, hourly hydro output may be shifted to “make room” for solar, but (4) keeps every hour between the plant’s minimum and maximum. This can limit FPV: there are periods when solar could displace hydro to store water in the reservoir, such as long droughts, and the model does not allow it.
Preserving daily hydro production is what keeps the model from “interfering” with reservoir operation. Letting it interfere would require the water balance of the cascade and a policy for the opportunity cost of stored water, so that FPV could be used to save water in critical moments. That expanded model would probably give FPV more room. It can be built by adding FPV to PSR’s SDDP and OPTGEN models.
Constraints (5) tie solar production to the ERA5 hourly production factor (p.u.) for the same period as the hydro records, multiplied by the capacity the model chooses to install. The variable is the curtailed part.
Constraints (6) cap cumulative curtailment at a fraction of cumulative production. For instance, allows at most 5% over the horizon. In practice it should not bind: the cost of the panels already discourages building output the grid cannot take.
Constraints (7) limit the reservoir area FPV may occupy. At 100 MW per km² and reservoir area , the scalar sets the cap. The value used here is , at most 3% of the surface.
Case study
Thirty-four hydropower plants account for 90% of the total available power injection capacity, so the optimization focuses on those. Hourly hydropower production from 2015 to 2023 comes from ONS. Solar radiation from ERA5 at each reservoir’s coordinates is converted to production for a fixed-tilt array without trackers, including the cooling effect of the water, which raises FPV efficiency relative to ground-mounted plants.
The capacity factors, ranked from highest to lowest, are below. As expected, Sobradinho, in the arid Northeast, produces more per installed MW than the reservoirs of the wetter South.
The price at which FPV sells its output is the historical hourly spot price of the plant’s submarket over the same nine years. Brazil has four pricing zones, and transmission congestion makes their prices differ, so where a reservoir sits matters to its economics. This is a counterfactual: it assumes the spot prices would be unaffected by the added solar generation, which is optimistic, since more solar would displace more expensive sources and lower the prices it earns.
With a 9-year horizon at hourly resolution and multiple plants, the problem has 5.37 million variables and 2.81 million constraints. It was solved with an interior-point barrier method, which suits problems of this dimension.
Of the 34 plants offered, the model selects FPV at 28. The chart below shows how much at each one. Together they add 24.6 GW, nearly half the hydropower nameplate of those plants, on 2.5% of their reservoir surface. Mean production is 4,229 MW, about 20% of the 21,236 MW the same plants generate from water, and only 31.9 MW of it is curtailed on average.
Twenty of the 28 sites sit at the 3% area cap. The rest stop earlier because the substation is small relative to the water: Sobradinho, the best solar site in the set, gets 1,429 MW on a 1,050 MW connection and no more. Curtailment is small everywhere: 31.9 average MW against 4,229 of production.
The excerpt below shows how the two sources share the connection hour by hour: aggregate hydropower and floating solar output over the first month of 2023.
Sensitivity to the interest rate
The feasible FPV capacity is also sensitive to the cost of capital. The model was run under the report’s base-case conditions, with a fixed contract price rather than spot prices, varying the real interest rate from 6% to 14%. That is why the 12% point sits at 17.6 GW instead of 24.6.
The result is flat at 27 to 28 GW from 6% to 10%, drops to 17.6 GW at 12%, and collapses to 4 GW at 14%. For a technology whose cost is almost entirely upfront, financing terms matter as much as the price of energy.
Conclusion
The theoretical potential of floating solar in Brazil is vast, thousands of gigawatts of reservoir surface, but the practical potential is set by what is around the water, not on it. Taking each plant’s grid connection, its operating limits and nine years of actual hourly production and radiation as given, the model finds a technical limit of about 24.6 GW at 28 reservoirs under historical spot prices, producing 4.2 GW on average: roughly a fifth of the hydropower output at the same sites, on 2.5% of their surface.
The hybrid operation is what makes this possible. The two sources share the substation, and hydropower shifts within the day to let solar through at midday and recover the energy in the evening, so almost nothing is curtailed. The result is sensitive to the cost of capital, flat up to a 10% real interest rate and collapsing above 12%, and it assumes spot prices unaffected by the added generation, which overstates the potential at this scale.
The natural next step is to let the reservoir participate: adding FPV to PSR’s SDDP and OPTGEN models would replace the fixed daily hydro production with the water balance of the cascade, so that solar could also be used to save water in critical periods. The report goes on from here to financial feasibility, the regulatory routes for FPV in Brazil and its environmental impacts.